CITI STYLE
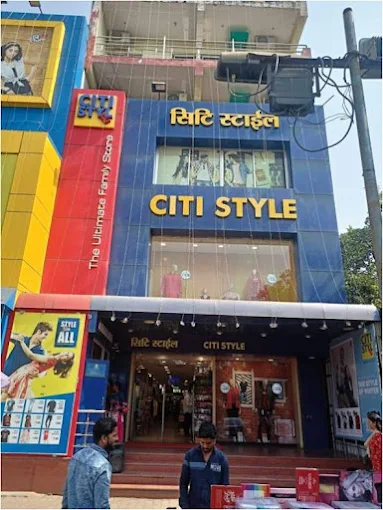
In the world of finance and technical analysis, the Citi Style (or Citigroup style) refers to a specific, clean visual format for financial charts and technical reports. It is designed to prioritize clarity and “at-a-glance” readability for traders and institutional clients.
Here is a breakdown of what defines the Citi Style:
Visual Aesthetics
The Citi Style is famously minimalist. It avoids “chart junk” (unnecessary gridlines, flashy colors, or overlapping indicators) to ensure the price action remains the focal point.
-
Background: Usually a crisp white or very light grey. This ensures that charts remain legible when printed or viewed in PDF reports.
-
Color Palette: A professional palette typically consisting of Navy Blue, Grey, and Dark Red.
-
Bullish bars/candles: Often outlined in Blue or Dark Grey.
-
Bearish bars/candles: Often filled or outlined in Red.
-
-
Typography: Uses clean, sans-serif fonts (like Arial or Calibri) for labels and axes to maintain a modern, corporate look.
Report Abuse
×| Open | Close | ||
|---|---|---|---|
| Monday | 10:00 am | – | 11:00 pm |
| Tuesday | 10:00 am | – | 11:00 pm |
| Wednesday | 10:00 am | – | 11:00 pm |
| Thursday | 10:00 am | – | 11:00 pm |
| Friday | 10:00 am | – | 11:00 pm |
| Saturday | 10:00 am | – | 11:00 pm |
| Sunday | 10:00 am | – | 11:00 pm |